
Kibana provides reporting capability for audit event data indexed into Elasticsearch. It is a browser based analytics and visualization platform which can be used to search, view, and interact with the audit data stored in Elasticsearch indices. Kibana provides the ability to perform data analysis and visualize this audit data in a variety of charts, tables, and maps.
You need to perform the following steps to get started with Kibana reporting.
For developer deployments of Elasticsearch and Kibana, please follow the Audit Service Deployment documentation. This includes configuration and running guidelines for the Audit Web Service, Elasticsearch cluster and Kibana in Docker.
The Audit Monkey can be used to generate and send significant volumes of audit event messages to Elasticsearch. Configuration and usage instructions are provided here. For the purposes of demonstrating Kibana reporting capability, the Audit Monkey should be run in demo mode.
Before you can start using Kibana, you need to tell it which Elasticsearch indices you want to explore. The first time you access Kibana, you are prompted to define an index pattern that matches the name of one or more of your indices. To configure which Elasticsearch indices you want to access, follow the steps below:
Point your browser at port 5601 to access the Kibana UI. For example, localhost:5601 or http://YOURDOMAIN.com:5601.
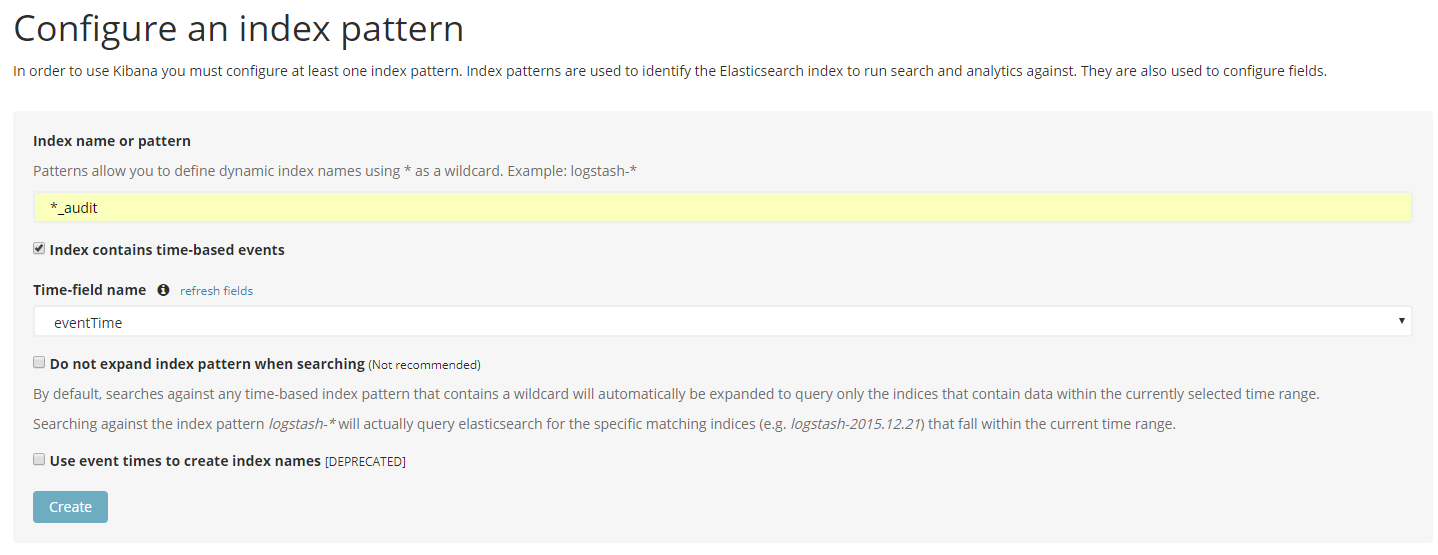
*_audit. Kibana will then support the exploration of all indices created via the Audit Monkey usage.eventTime field indexed into Elasticsearch for each new audit event message.The Audit Service Deploy Project comprises a set of saved dashboards, saved searches and visualizations that can be imported into Kibana in order to explore and visualize the audit event messages in a variety of ways. Import instructions are provided next:
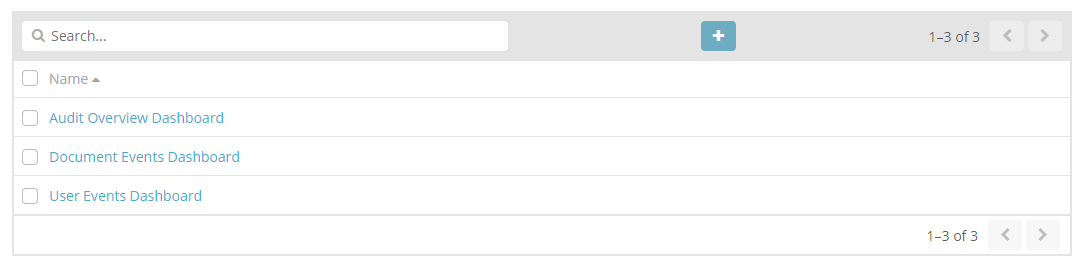
You can begin to explore and visualize the audit event messages indexed into Elasticsearch using the new dashboards.
The Audit Overview Dashboard displays a collection of visualizations and a saved search to present a summary of all audit events indexed into Elasticsearch.
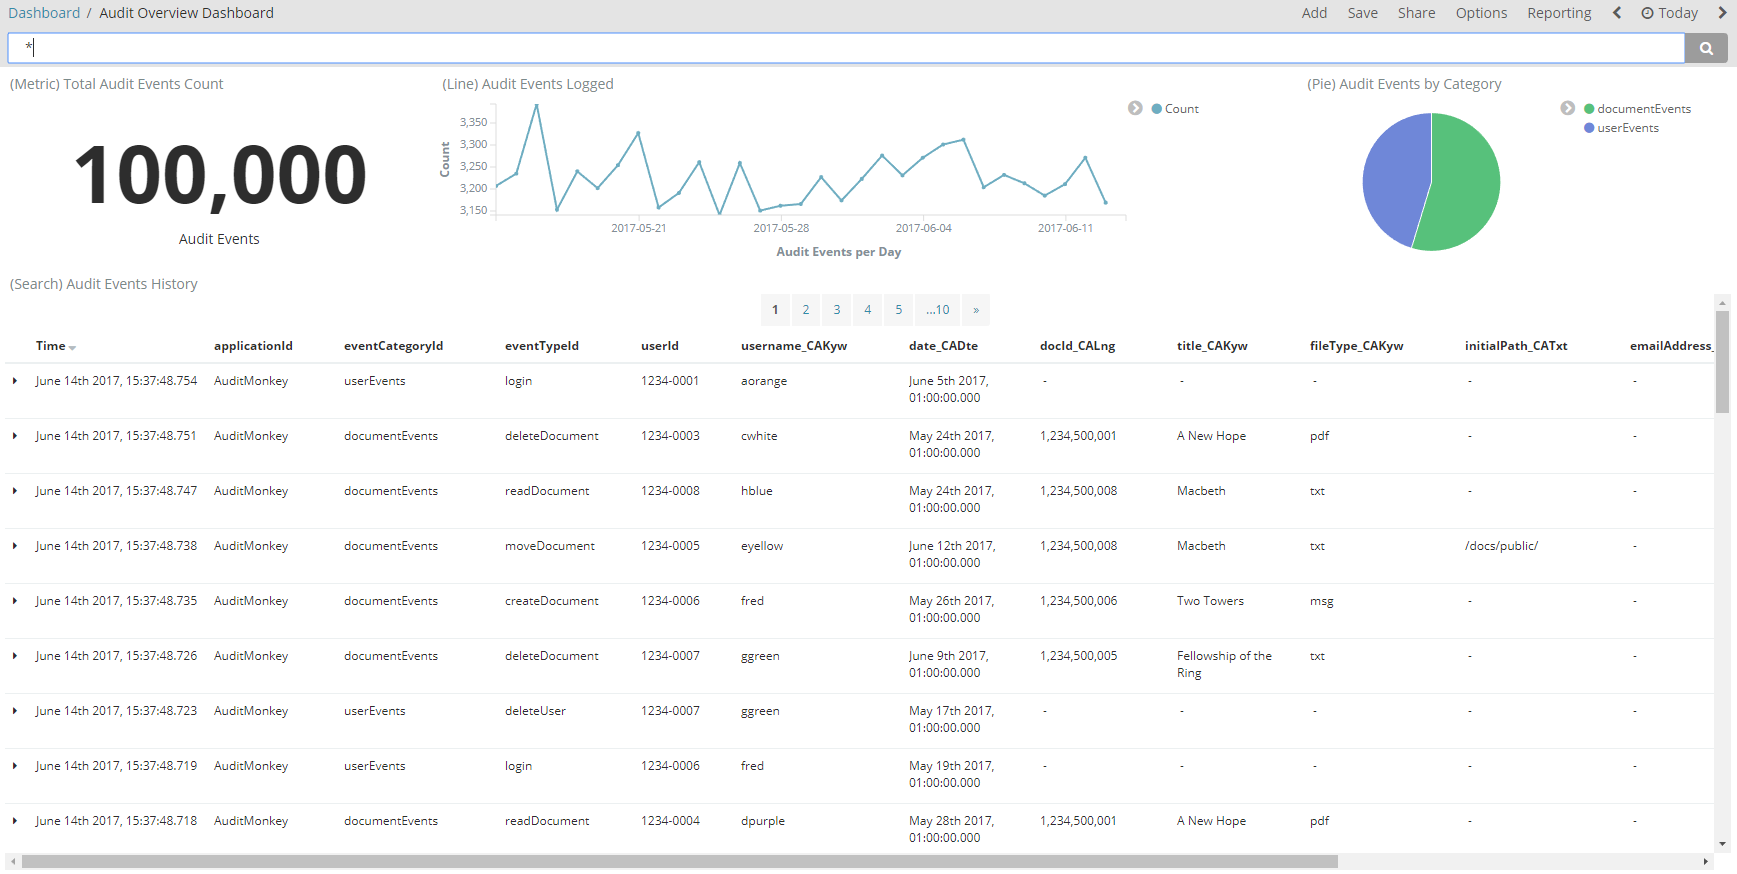
The dashboard includes:
As illustrated, audit events are categorized by document and user events only.
The Document Events Dashboard displays a collection of visualizations and a saved search to present a summary of all document events indexed into Elasticsearch.
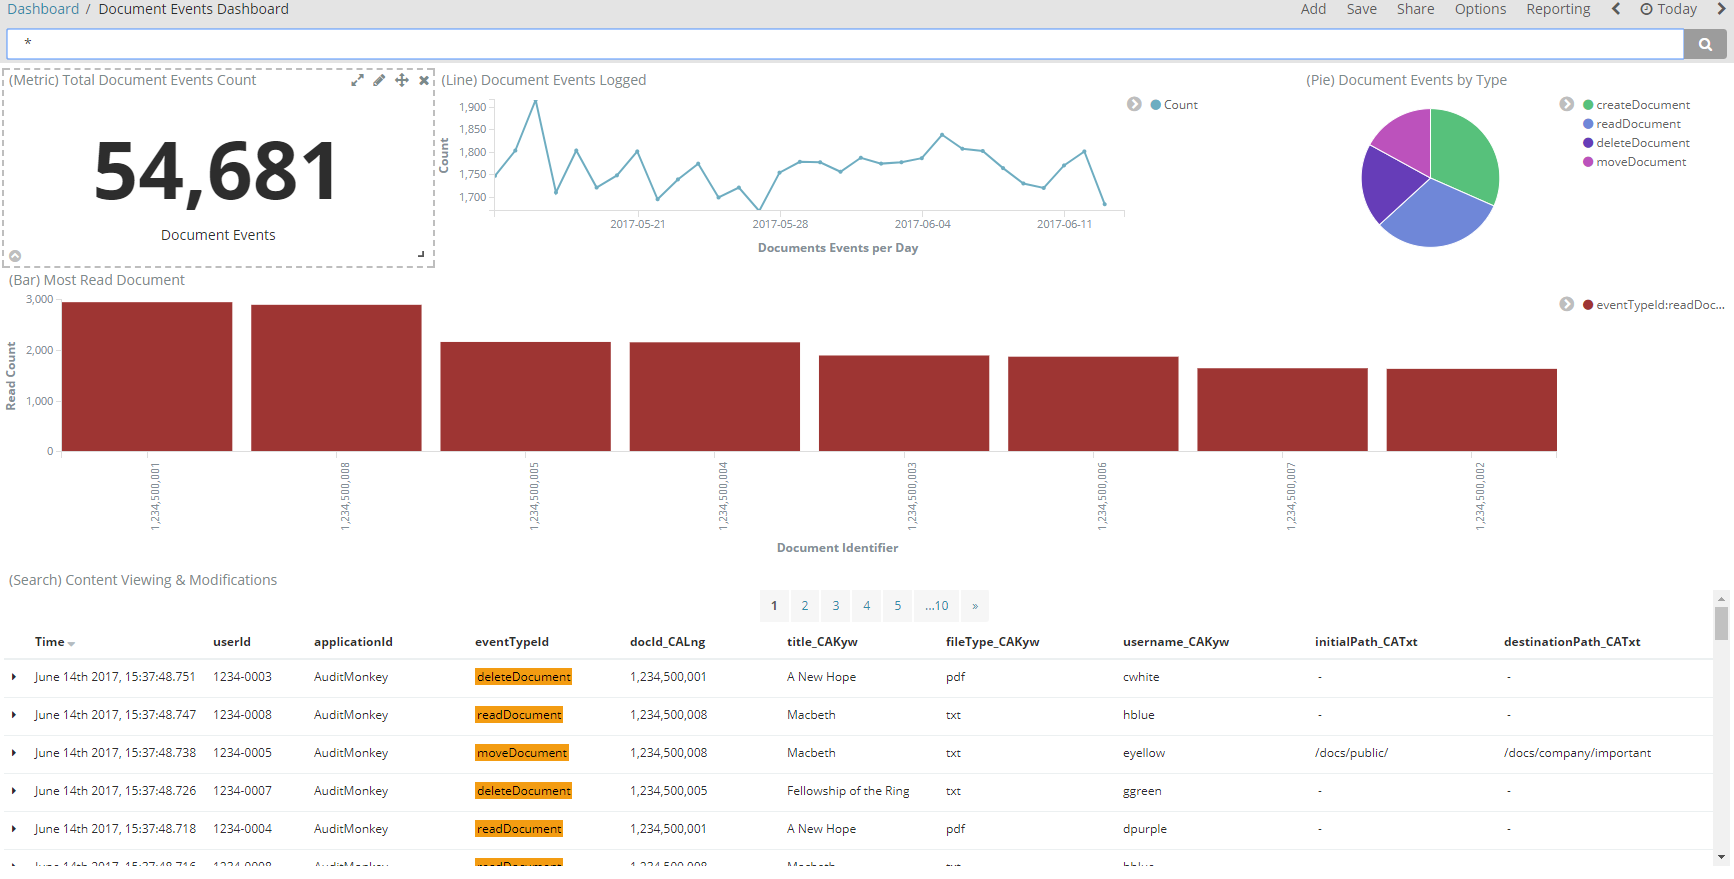
The dashboard includes:
The User Events Dashboard displays a collection of visualizations and a saved search to present a summary of all user events indexed into Elasticsearch.
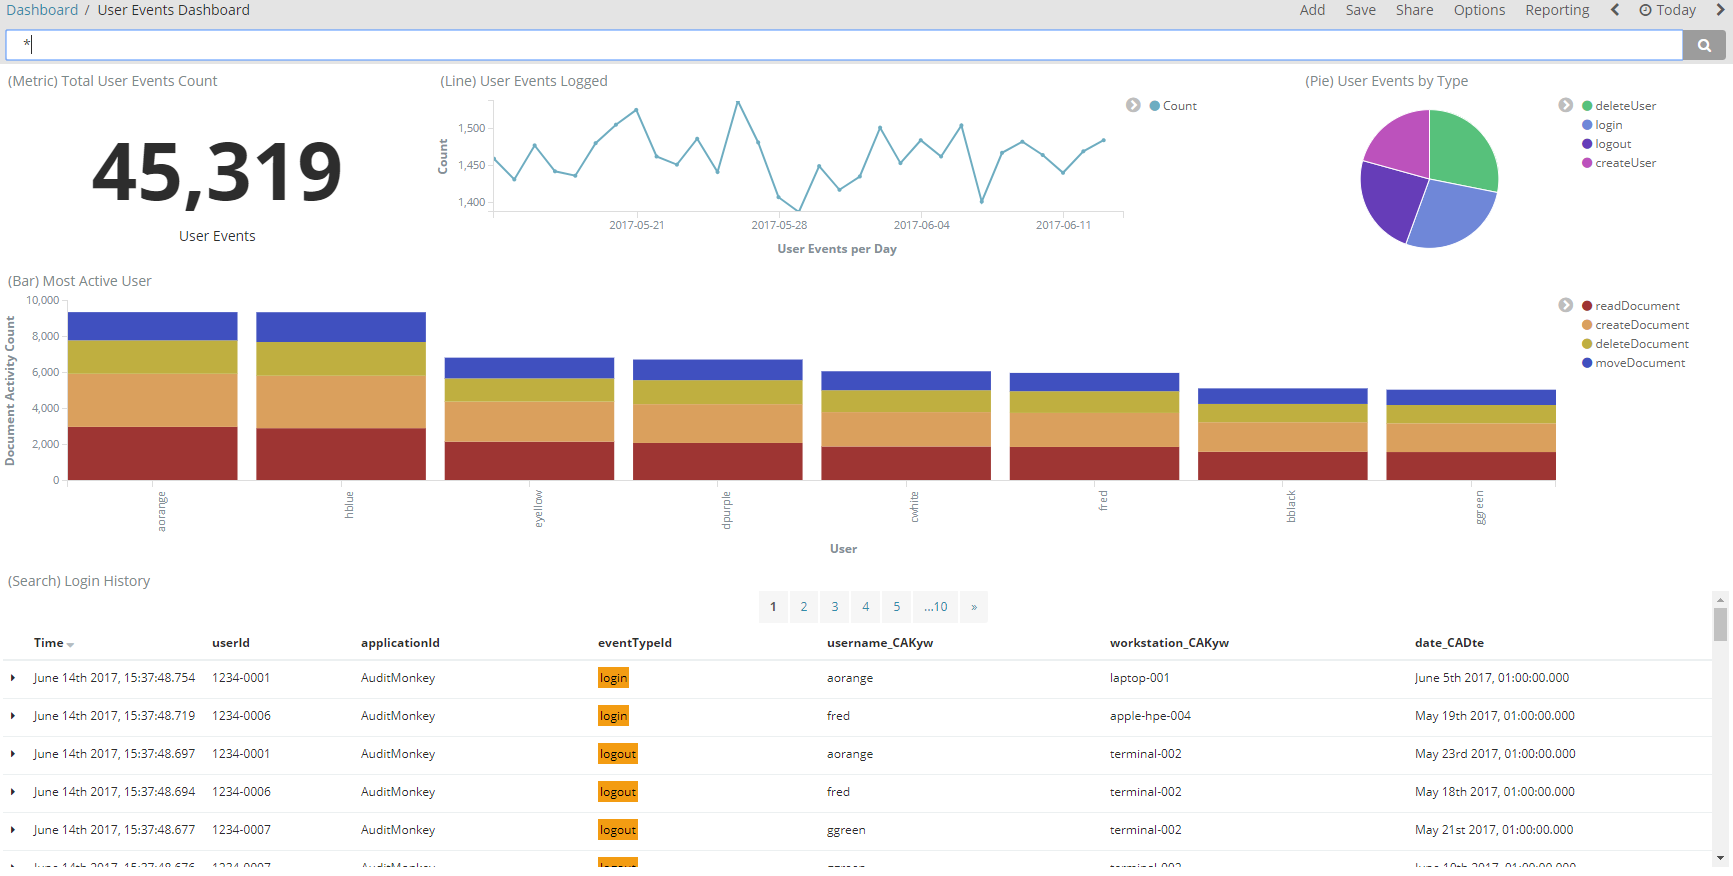
The dashboard includes: